
Thermal Waveguide Tuner (HEAT)#
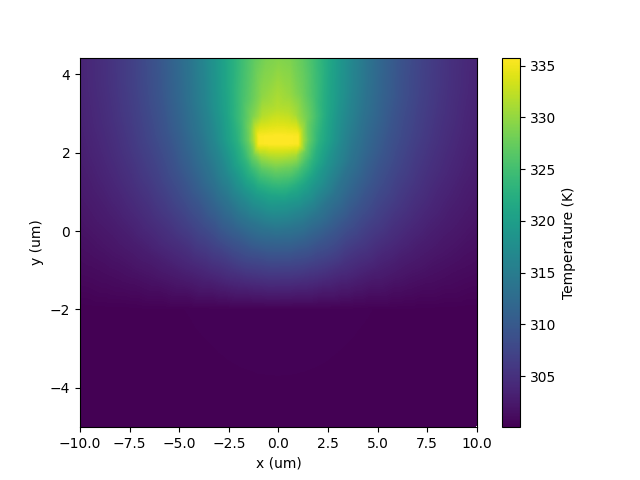
Getting started example for HEAT simulation with PyLumerical. Calculates the temperature profile for a thermal waveguide tuner. Prerequisites: Valid HEAT license is required.
[ ]:
1import matplotlib.pyplot as plt
2import numpy as np
[ ]:
3import ansys.lumerical.core as lumapi
[ ]:
 4with lumapi.DEVICE() as device:
 5    # Create materials
 6    device.addmodelmaterial({"name": "Silicon"})
 7    device.addmaterialproperties("HT", "Si (Silicon)")
 8
 9    device.addmodelmaterial({"name": "Aluminium"})
10    device.addmaterialproperties("HT", "Al (Aluminium) - CRC")
11
12    device.addmodelmaterial({"name": "SiO2"})
13    device.addmaterialproperties("HT", "SiO2 (Glass) - Sze")
14
15    device.addmodelmaterial({"name": "Air"})
16    device.addmaterialproperties("HT", "Air")
17
18    # Create geometry
19    device.addrect({"name": "substrate", "x": 0, "x span": 0.45e-6, "y": 0.11e-6, "y span": 0.22e-6, "z": 0, "z span": 1e-6, "material": "Silicon"})
20    device.addrect({"name": "waveguide", "x": 0, "x span": 100e-6, "y": -21e-6, "y span": 38e-6, "z": 0, "z span": 1e-6, "material": "Silicon"})
21    device.addrect({"name": "oxide", "x": 0, "x span": 100e-6, "y": 4e-6, "y span": 12e-6, "z": 0, "z span": 1e-6, "material": "SiO2"})
22    device.addrect({"name": "air", "x": 0, "x span": 100e-6, "y": 7.21e-6, "y span": 5.58e-6, "z": 0, "z span": 1e-6, "material": "Air"})
23    device.addrect({"name": "wire", "x": 0, "x span": 2e-6, "y": 2.32e-6, "y span": 0.2e-6, "z": 0, "z span": 1e-6, "material": "Aluminium"})
24
25    # Set simulation region
26    device.select("simulation region")  # Simulation region named "simulation region" is included in new simulation by default
27    device.set({"dimension": "2D Z-Normal", "x": 0, "x span": 80e-6, "y": 0, "y span": 18e-6, "z": 0})
28
29    # Add HEAT solver object
30    device.addheatsolver({"norm length": 200e-6})
31
32    # Add boundary conditions
33    device.addtemperaturebc("HEAT")
34    device.set({"temperature": 300, "surface type": "simulation region", "y min": True})
35
36    device.addconvectionbc("HEAT")
37    device.set({"h convection": 10, "surface type": "material:material", "material 1": "SiO2", "material 2": "Air"})
38
39    # Add heat sources
40    device.adduniformheat(
41        {"geometry type": "volume", "volume type": "solid", "volume solid": "wire", "use solver norm length": True, "total power": 0.02}
42    )
43
44    # Add monitors
45    device.addtemperaturemonitor(
46        "HEAT", {"name": "temperature monitor", "monitor type": "2D z-normal", "x": 0, "x span": 20e-6, "y min": -5e-6, "y max": 4.42e-6, "z": 0}
47    )
48
49    # Run simulation
50    device.save("thermal_tuner.ldev")
51    device.run("HEAT")
52
53    # Visualize results
54    results = device.getresult("HEAT::temperature monitor", "temperature")
55
56    # HEAT results are returned in an unstructured dataset, need to be converted to a rectilinear grid for pyplot
57    vertices = device.getdata("HEAT::temperature monitor", "temperature", "vertices")
58    elements = device.getdata("HEAT::temperature monitor", "temperature", "elements")
59    temperature_unstructured = results["T"]
60
61    x = np.linspace(-10e-6, 10e-6, 1000)
62    y = np.linspace(-5e-6, 4.42e-6, 1000)
63
64    temperature = device.interptri(elements, vertices[:, :2], temperature_unstructured, x, y)
65
66    # Plot temperature profile
67    im = plt.pcolormesh(x * 1e6, y * 1e6, temperature.T, shading="nearest")
68    cbar = plt.colorbar(im)
69    cbar.set_label("Temperature (K)")
70    plt.xlabel("x (um)")
71    plt.ylabel("y (um)")
72    plt.show()